Turn Data Into
Decisions
Surview builds live, interactive dashboards that connect every data source you have — surveys, CRM, operations — into one clear, real-time view for your entire organisation.
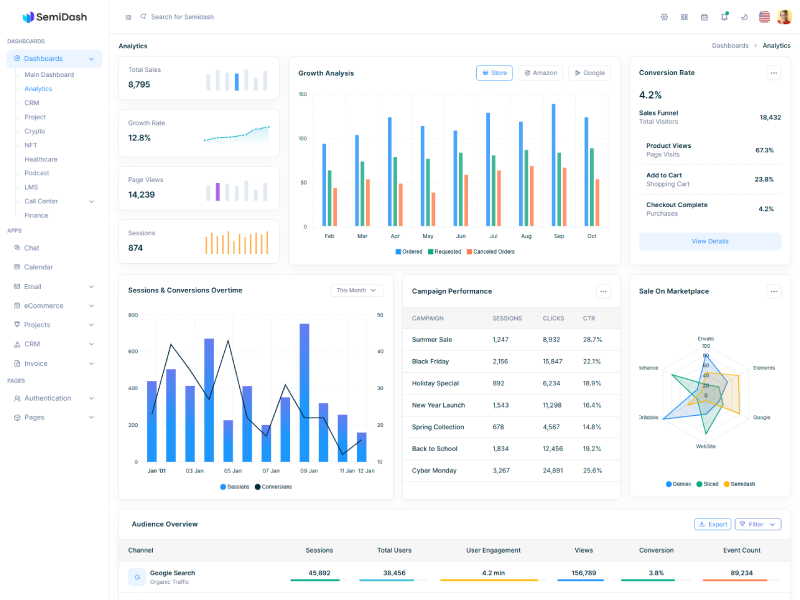
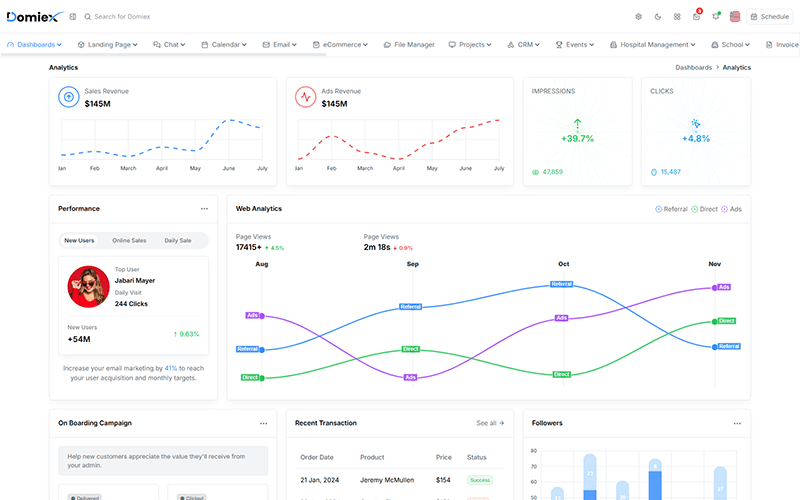
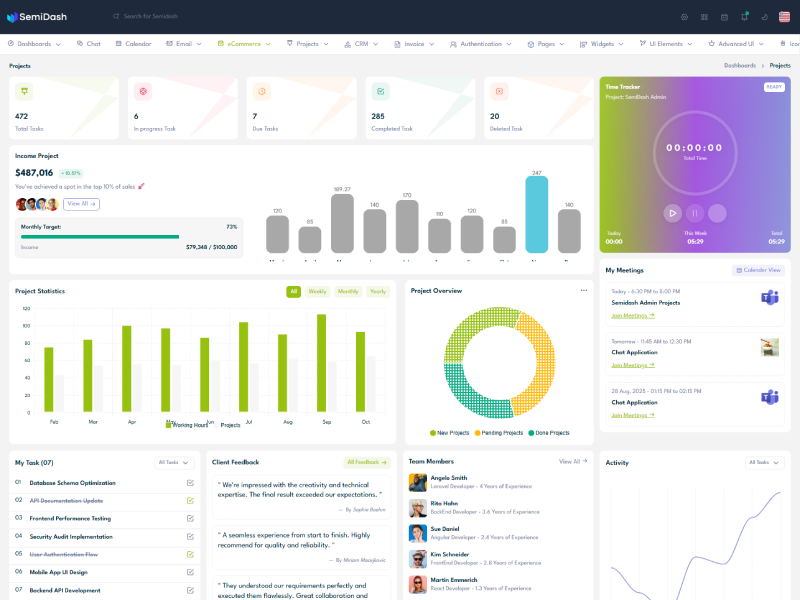
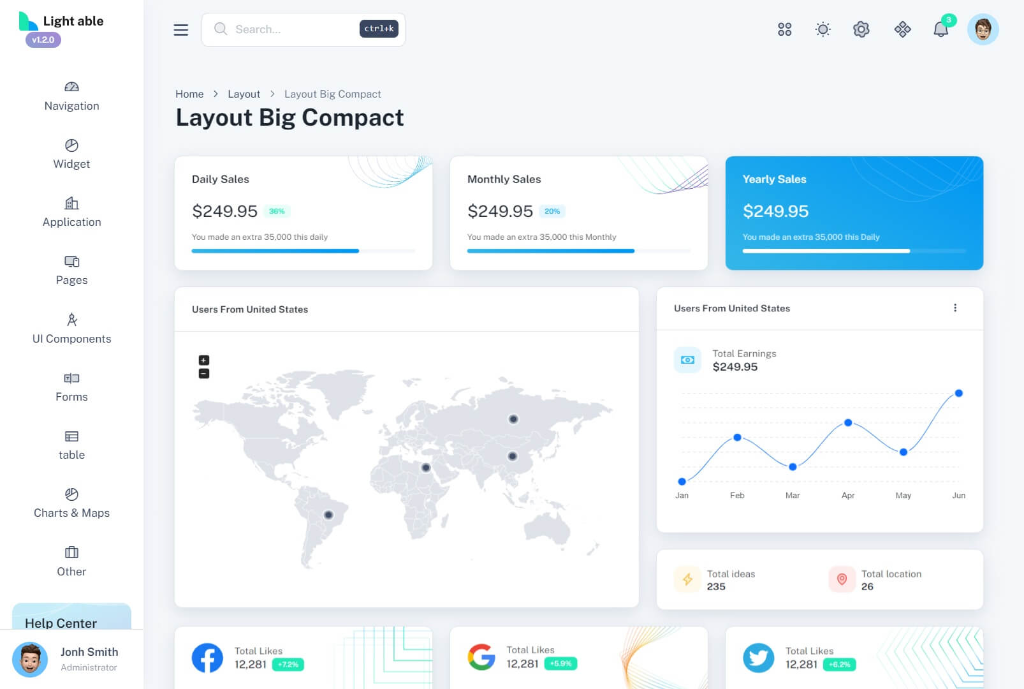
What is a Dashboard?
A dashboard is a visual interface that consolidates and presents your most important metrics in a single, organised view.
Modern dashboards go far beyond static reports. They pull live data from multiple sources, update in real-time, and let users interact — filtering, drilling down, and comparing — to uncover insights that a spreadsheet would hide.
Operational
Monitor daily activities — response rates, NPS scores, support tickets — across your organisation in real time.
Analytical
Dig deep into historical trends, statistical correlations, and segment comparisons to guide strategy.
Strategic
High-level executive views tracking long-term KPIs, market benchmarks, and financial outcomes.
Tactical
Mid-level team dashboards tracking weekly progress toward targets, project milestones, and SLAs.
The Surview Dashboard Approach
We don't just build charts — we design decision-making tools. Our end-to-end process takes your raw data and turns it into a living, breathing intelligence centre for your organisation.
Discovery & Data Mapping
We start by understanding your goals, KPIs, and existing data sources. Our team maps every data feed — survey platforms, CRMs, ERPs, databases — to design a unified data architecture.
Design & Prototyping
We wireframe your dashboard layout, choosing the right chart types for each metric. Every visual is crafted to communicate clearly, not just look impressive.
Build & Connect
Our engineers connect live data sources and build interactive widgets. Real-time pipelines ensure your dashboard always reflects current data — no manual imports.
Deploy & Iterate
We deliver, train your team, and continue to refine. As your business evolves, your dashboards evolve too — with ongoing support and enhancements.
Live Surview Dashboards
These aren't mockups. Click to explore real, live dashboards built by Surview — fully interactive, updated in real-time.
Cunning Pulse – Data Flow
Real-time data flow analytics with live KPIs, trend lines, and multi-source integration.
Dubai Care Pulse
Healthcare performance dashboard tracking patient satisfaction, service quality, and operational KPIs.
Benefits of Dashboards
Well-designed dashboards don't just look good — they fundamentally change how teams operate, communicate, and grow.
Instant Clarity
Transform thousands of data points into one glanceable view. Decision-makers see exactly what matters — no spreadsheet hunting required.
Faster Decisions
Real-time dashboards shrink the gap between data and action. Spot trends the moment they emerge and respond before competitors do.
Align Your Team
Shared dashboards create a single source of truth. Every team member, from front-line staff to executives, works from the same numbers.
Drill Into Detail
Interactive filters let you slice data by date, location, segment, or any custom dimension — revealing the "why" behind every metric.
Save Hours Weekly
Automated reporting eliminates manual data compilation. Scheduled email delivery keeps stakeholders informed without any extra effort.
Secure & Governed
Role-based access ensures each person sees only the data they need. Enterprise-grade security keeps sensitive insights protected.
Any Device, Anywhere
Fully responsive dashboards work on desktop, tablet, and mobile. Access your data live from any location, at any time.
AI-Powered Alerts
Set smart thresholds and receive instant notifications when KPIs fall outside expected ranges — before issues become problems.
Dashboard Gallery
From executive overviews to granular operational views — every dashboard tells a different story.
Key Features
Drag & Drop Builder
Build custom dashboards in minutes with an intuitive visual editor and pre-built widget library.
Real-Time Data
Dashboards update the moment new survey responses arrive. No manual refresh, no stale numbers.
Interactive Visualizations
30+ chart types including heatmaps, gauges, funnels, geographic maps, and custom KPI tiles.
Automated Scheduling
Schedule snapshot reports delivered by email — daily, weekly, or at any custom cadence.
Role-Based Access
Granular permission settings ensure every stakeholder sees exactly the data relevant to them.
White-Label Embedding
Embed fully branded dashboards into your own portal or application with zero Surview branding.
Ready to transform your data strategy?
Join 500+ organizations that trust Surview for their survey management and data analytics. Get started with a free consultation today.